Data by itself doesn’t do much good. But data in the proper context can be powerful.
A survey of Wisconsin sewer rates by an in-state engineering firm offers value for communities and wastewater utilities. MSA Professional Services has conducted this survey every three years since 1996.
Many of the facts, figures and trends are interesting in themselves. Their real worth, though, comes from using them in the context of discussions with the public about facility expansions and upgrades that will lead to rate increases. They also come in handy for general conversations about the costs of managing wastewater and keeping the environment clean.
The Cost of Clean: 2025 Wisconsin Sewer User Charge Survey Report is built on data supplied by 239 municipalities covering a broad range of sizes. Its lessons can extend well beyond its state’s borders. Pat Morrow, P.E., wastewater engineering team leader at MSA, talked about the survey and its potential uses in an interview with Treatment Plant Operator.
TPO: Why has your firm made this study a recurring project?
Morrow: MSA serves a gamut of communities, many of them very small. We’d be telling their leaders they needed to upgrade their treatment plant for whatever reasons. That’s millions of dollars, and suddenly we’re talking about the impact on sewer rates. The survey also came from communities’ desire to see how they compare. When we presented new rates at public hearings, people would ask, “Are we being treated unfairly? Who else pays a rate of this size?”
TPO: Do firms like yours in other states do sewer rate surveys?
Morrow: There is a firm that primarily does so for Minnesota and the Dakotas in addition to a few adjacent states, but it’s historically been a smaller sample size than ours and not focused solely on Wisconsin.
TPO: Could the basic information and trends in this survey apply to a wider geography?
Morrow: I think so. Wastewater rates don’t change all that much across the continental U.S. They’re largely driven by how strict the effluent limits are. We’ve talked about casting a wider net, especially in other states where we have offices: Minnesota, Illinois, Iowa and Florida.
TPO: How have sewer rates increased since the first survey in 1996 relative to drinking water rates?
Morrow: Over that span, sewer rates have increased by an average of 6.9% per year while water rates have increased by 4%. Sewer rates have increased more because typically water treatment costs less than wastewater treatment.
TPO: How do sewer rates compare based on community or utility size?
Morrow: In general, smaller communities pay higher rates for wastewater service than larger communities. That’s because of economies of scale, and because in setting permit limits, the DNR doesn’t discriminate based on population. If you’re a small community discharging to a given receiving stream, you have to meet the same permit limits as a large community.
TPO: What is the trend over time in water usage, which is the basis for sewer rates?
Morrow: People are using less and less water. Every time we do the survey, the water use is lower. The 2024 average day residential water use was nearly 29% lower than in 2006, a decrease of about 1.6% per year. Part of that is due to better plumbing fixtures, such as low-flow showerheads and water-saving toilets. Some is due to water conservation and socioeconomic factors: As rates increase, people become more conscious about letting the water run.
TPO: How frequently are municipalities raising their sewer rates?
Morrow: Our 2025 data indicates that the number of years since the last sewer rate adjustment has decreased across all population ranges versus 2022. The 2025 statewide average time since the last sewer rate increase is about 3.1 years; the median is 1.4 years. This indicates that many communities have adjusted their sewer rates recently. In 2025, 49% of respondents said a rate increase will be necessary within the next year; the average expected increase was 11%.
TPO: What does the survey show about communities’ willingness to raise rates?
Morrow: In general, they are getting a little less shy. I use the analogy that the gas company isn’t bashful about 3% increases year over year to cover inflation. Historically, city councils and utility boards want to keep rates low because it makes them feel good. But at the same time they may be doing a disservice to the community because then when they need a major upgrade, the rate increase can be a shock. We’ve seen communities ask for 30%, 40% and 50% increases.
TPO: How do rates in a given community tend to change over time?
Morrow: It’s very cyclical. Permits get renewed, upgrades happen and those with higher sewer rates tend to be the ones who most recently had to do a major project. In time, everybody takes a turn toward the top, and then as years go by, their ranking goes down as other utilities pass them up.
TPO: How do rate comparisons come into play in community discussions?
Morrow: Our report includes appendices where individual communities’ rates are listed. Often at public hearings I have to give the news that an upgrade is coming and sewer rates will probably rise. It’s comforting to communities if they’re not at the top of the list. I might say, “Right now you’re in this bracket; after the upgrade you’ll end up here, but you still won’t be all the way at the top.” We can also compare their rates to similar communities nearby. What we tend to see is that similar-size communities pay similar rates.
TPO: What is happening with sewer hookup fees and impact fees?
Morrow: Fifty-two percent of respondents to the 2025 survey charge a hookup fee for new connections. Only 5% have implemented impact fees. Historically, the percentage charging hookup fees is increasing, largely due to user rates getting more and more expensive.
TPO: What is the difference between hookup fees and impact fees?
Morrow: In simple terms, a hookup fee is a specific charge for the initial sewer connection. An impact fee is a more precise charge that aims to account for the actual effect a new development will have on costs for the sewer system: increased energy cost for a lift station, the chemical costs for phosphorus removal and so forth.
TPO: What shares of treatment plants accept septage and holding tank waste?
Morrow: About 37% of 2025 survey respondents said they accept holding tank waste; about 31% take septage. Not surprisingly, the acceptance rate is significantly higher in larger communities with more treatment capacity. Small communities often can accommodate holding tank waste better than septage. It is arguably always better to run septage through a treatment plant, if possible, than to land-apply.
TPO: What share of utilities have surcharges for certain wastewater constituents?
Morrow: Thirty-seven percent of respondents said they have a surcharge for high BOD or TSS. About 36% have a phosphorus surcharge, and 19% have a nitrogen surcharge. The prevalence of surcharges is significantly higher in communities with larger populations that have treatment facilities in place to accommodate high-strength wastewater.
TPO: What is the trend related to nitrogen and phosphorus surcharges?
Morrow: Those surcharges are increasing in frequency and cost. Phosphorus especially is very costly to remove. In terms of surcharges, it’s the most costly of all the pollutants.
TPO: How feasible is biological phosphorus removal for various facilities?
Morrow: Not everybody can do bio-P. It’s related to community size. The smaller the community, the higher the diurnal and seasonal flow swings. Plants with highly variable flows don’t lend themselves well to bio-P. The capital cost is high, and the process can be really tricky to operate for small communities. In larger communities with the right wastewater constituents, bio-P is quite common. There are facilities that can get down well below 1.0 mg/L and even down to 0.2- 0.3 mg/L. Tertiary filtration can then take it down to 0.07 mg/L or lower.
TPO: What would you say is the optimal method for dealing with phosphorus?
Morrow: Treating to super-low levels isn’t the answer in places where we can avoid it. The answer is to treat to a more reasonable target, and then remove the additional phosphorus from the watershed through adaptive management or water-quality trading.
TPO: How satisfied are you with the response to your survey questionnaires?
Morrow: We distributed 2025 email survey forms to 814 municipal WPDES discharge permit holders, and our response rate was 29%. That rate has been going down. It peaked in 2010 at more than 500 responses. In 2022 the rate was about 40%. We’re looking at how we can do more promotion when we send the surveys out, such as by leveraging partners like the Wisconsin Rural Water Association, the Wisconsin Wastewater Operators Association and our state AWWA section. We want to make it as easy as possible for folks to respond.
TPO: How can community leaders help their residents keep sewer rates in perspective?
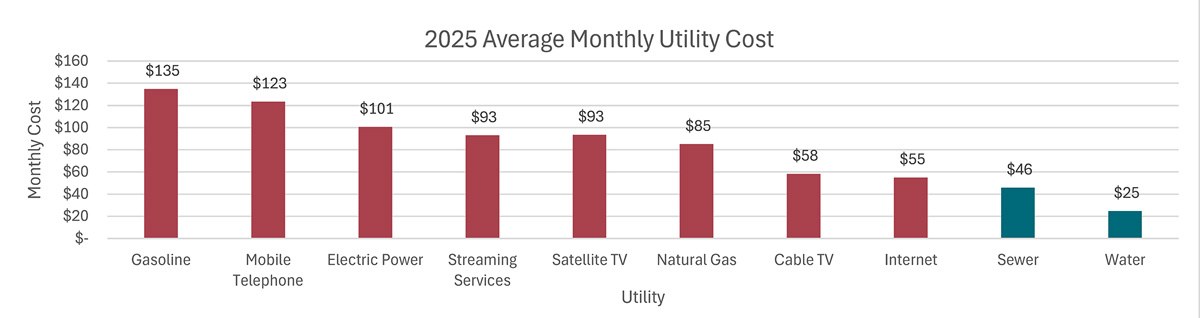
Morrow: We often compare sewer and water rates to the costs of other things they pay for. How do the costs of providing safe water and keeping our receiving waters clean compare with the prices we pay for internet, cellphones, TV streaming services and gasoline for our vehicles? Experience shows that the utility costs are less. Yes, they’re still significant, but in terms of the overall goal, what if we didn’t have those services?