Geographic Information Systems are essential tools for maintaining and managing water and wastewater utility infrastructure.
But GIS data can slip out of date as crews make changes or updates to assets in the field and GIS technicians fall behind on entering the new information. When that happens, field personnel can’t be fully confident that the GIS information is accurate and timely.
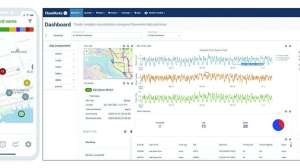
MentorAPM addresses this issue, and delivers other asset management benefits, with its recently upgraded MapViews toolset. MapViews enables operations, maintenance and capital planning personnel, including those with no GIS background, to show and track asset updates that immediately become visible on their own map view.
The new MapViews capability integrates with the utility’s ESRI GIS database and displays the information within the MentorAPM platform. It is helpful for monitoring the progress of asset management programs like valve-turning, lead service line replacement and hydrant-flushing.
Company leaders describe MentorAPM as an end-to-end asset management lifecycle platform that resembles a computerized maintenance management program, but has broader capabilities to support tasks ranging from generating and managing work orders to formulating asset investment and capital plans.
Treatment Plant Operator explored the latest MapViews offering in an interview with John Clow, chief operating officer; Dee Clawson, chief architect; and Jennifer Zach, chief marketing officer.
TPO: How does MapViews help keep network information current?
Clow: Utilities typically have a backlog in their GIS departments for entering changes, additions, removals and retirements of assets in their network. That backlog can extend to weeks if not months. We enable the field staff to make immediate updates to visualize information they encounter as they do their jobs, instead of waiting for the GIS department.
TPO: What enables people who are not GIS specialists to do these things?
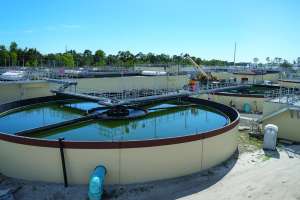
Clawson: We’ve added a simple set of tools for average users. So for example, someone who wants to enter a clarifier in a map view of a treatment plant could simply select “clarifier” as an asset type, draw it as a polygon on the map, and assign a color to it. Users can also sign symbols and images. We also have tools in MapViews that enable users to track asset histories.
TPO: Can MapViews be used to create maps of treatment facilities as well as collection and distribution networks?
Clawson: Yes. Often, utilities only build out the linear side of their systems in GIS — the lines, hydrants, manholes and pump stations. But for someone working in a wastewater treatment plant, it’s easier to go to a map and locate something than to cycle through a listing of hundreds or thousands of assets in a table. So just by clicking on a building, they can view all the assets inside, and have access to the entire hierarchy of information about them. It’s a way to enable common users to get to information quicker.
TPO: How does new information entered by crews in the field make its way into the GIS?
Clawson: As assets are adjusted, personnel in the field can notify the GIS department of the changes. Through an editor tracking function, they tell the GIS software that, for example, this valve is incorrectly labeled, or this pipe size is incorrectly identified. The GIS technicians then implement the changes in the GIS database.
TPO: How are the map displays structured?
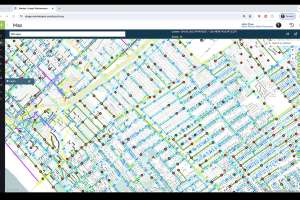
Clow: We integrate with the utility’s GIS, and staff members identify the features they want to display. For example, they can integrate a combination of network information: sewers, water lines, hydrants, valves. They can turn all those features on and display them on a map. Or if they want to see only hydrants and the related information, they can turn only that feature on.
TPO: How can utilities use MapViews to support asset management and capital planning?
Clawson: In maintaining their infrastructure, utilities perform inspections and assign condition scores to assets. They can take that data and overlay it on a map view to obtain a direct picture of what is critical to their operations and where they are at the greatest risk of failure, based on the asset age and condition. From there they can make informed decisions on how to invest in their assets in the most appropriate manner.
TPO: Do assets automatically change their appearance on the map as they age?
Clawson: Yes. As assets age and as their condition changes, they change color. This enables utilities at any given time to see a snapshot of their infrastructure’s status.
TPO: Can the mapping function be used to isolate a street or a specific location?
Clawson: Yes. Suppose someone calls and says they see a lot of water at an intersection. The utility doesn’t know if it’s a broken water main or a leaking hydrant. We allow them to do a pin drop and generate the latitude and longitude of the location. Then they can create a work order and dispatch a crew to investigate. The crew can then use that same work order to update that the hydrant or water main needs repair. From our MapViews program, they can also punch out to Google to get a street view of the location beforehand, to prepare in case there may be overgrown vegetation hiding the asset or other obstructions.
TPO: How can this capability be used to track the progress of a maintenance or inspection program?
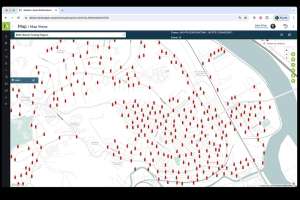
Clawson: Consider an example from a water utility in California. They have an annual inspection program for backflow devices in residential and commercial locations. All they used to have was a list of addresses; nothing on a geographical map. We loaded all that information into MapViews. We geocoded the data and generated the latitude and longitude coordinates of the addresses so they could see the information on a map. Now blue dots represent locations where inspections need to be completed, and red dots represent inspections that are past due. We did something similar for their hydrant and grease trap inspections.
TPO: How does MapViews interact with the GIS?
Clawson: It doesn’t change or affect the GIS, which remains the record of truth for their network. As the GIS editors make updates and changes, our interface picks up that data and pulls it into MapViews to get the two systems back in sync. Before that happens, the field crews can use MapViews to have a sense of what is out there in the field without having to worry about looking at older data that is not accurate.
Zach: I liken the ESRI GIS database to the old Rand McNally map books that were published and updated every year. Our MapViews would be like overlaying a transparency on top of a map to see the current data, without having to wait for the new map books to be printed.