Building a new wastewater treatment plant generally involves a delicate balance between meeting both present and future needs. While the industry continues to innovate ways to phase in treatment capacity by increments as demand increases, it is all too common that the capacity of a new plant far exceeds actual loading for many years.
In addition, in the interest of keeping costs down, new plants often lack sufficient flexibility (turndown) to meet stringent total nitrogen limits at startup flows. Without built-in turndown, the onus is on operators to understand the biological process and find innovative ways to meet the limits until loading increases to design levels.
The experience of an MBR treatment plant in Florida shows how operators can cost-effectively adjust processes to handle low startup flows while still meeting strict permit limits on total nitrogen in effluent.
Understanding the process
In an activated sludge plant, various biological processes are selected for use in different zones to convert nitrogen pollutants into either biosolids (through assimilation) or harmless nitrogen gas.
Without getting into the details, two significant steps must occur at one or more points in the process to convert enough nitrogen to meet tough limits. These are nitrification (conversion of ammonia nitrogen to nitrates) and denitrification (conversion of nitrates to nitrogen gas). The trick is making sure enough of each is happening somewhere in the plant, at some time.
There are many ways to combine process zones, also called selectors, to achieve specific process objectives like total nitrogen removal. The myriad combinations are lumped into categories (flowsheets) with different names like MLE, AO, A3O, Bardenpho and UCT.
Our example looks at an MBR system (Figure 1) where denitrification happens at three steps: in the pre-anoxic (PRAX) zone, the swing zone and the post-anoxic (POAX) zone. On the other side, nitrification is designed to occur in both the swing zone and in the MBR (also called the membrane zone). A single internal recycle (IR) stream returns nitrates to the front of the process for denitrification. For those not familiar with this type of MBR process, a comparison to a similar flowsheet using sedimentation appears in Figure 2. Note that the oxic zone implies aerobic conditions, or most likely the use of fine-bubble diffusers followed by a clarifier.
Performing a mass balance
Once the process is understood, the next step is to figure out what is actually happening, and where, by conducting a mass balance. A mass balance amounts to a simple accounting of oxygen and nitrogen species in the process. Measuring dissolved is usually straightforward and can be accomplished using handheld or online analyzers.
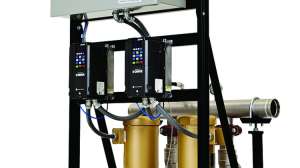
For tracking nitrogen, online analyzers can be leased or purchased and moved around the process for use in trending ammonia and nitrates. Simple snap kits are also effective for putting together a useful mass balance. A sample mass balance around one process zone is shown in Figure 3.
Note, there are two parts to a mass balance: the species concentration and the flow rate of the stream. Often overlooked or misunderstood is the flow part to a mass balance, specifically the amount of nitrification that is supposed to occur in the MBR.
The confusing part is the perception of low concentration. For example, it is easy to look at the numbers in Figure 3 and determine that not much nitrification is happening in the MBR. After all, only 2.0 mg/l of ammonia is coming into the zone.
But savvy operators need to consider the mass of ammonia going into the zone, which is substantial. Assuming typical municipal strength waste (30 mg/l NH2), and assuming that 20 gpm is coming into the plant (equal to permeate leaving), roughly 30 percent of the nitrification is happening in the MBR — not an insignificant amount. This ratio is for illustration purposes, but is not too far off the mark for real plants.
So once you have done the homework to understand how the plant is supposed to work, and you have completed the testing to figure out what is really happening in each process zone — now what? What options do you have to make fixes without spending a lot of money on potentially short-term remedies?
Potential solutions
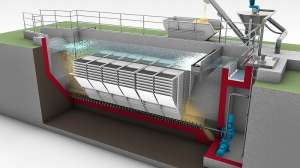
In any MBR system, diffused air is used to scour submerged membrane units during filtration, and that inevitably adds some amount of dissolved oxygen to the process. A unique aspect of the flowsheet presented here is the single recycle from the MBR back to the PRAX zone.
This cost-saving measure can be effective with sufficient built-in aeration turndown, but can be problematic with little or no control of air scouring. The problem of excessive aeration can be compounded by built-in filtration redundancy (installing extra submerged membrane units) and the lack or supplemental aeration turndown (the fine-bubble diffuser system and blowers).
So, if you’re having trouble with turndown, three suggestions to improve nitrogen removal efficiency are:
• Implement a control strategy to bring on process and filtration capacity incrementally as a function of actual demand. This may involve programming changes. Also consider proportional air scouring as a function of membrane flux, depending on supplier recommendations.
• Implement a control strategy to allow for flexible on/off times (semi-batch mode) of diffused air systems (for example, in the swing zone).
• Temporarily modify the flowpath through the plant or convert zones (for example, equalization to PRAX) to deoxygenate the mixed liquor or promote additional denitrification.
Case in point
So what proof is there that some variation of these strategies can help you improve total nitrogen removal in the face of low loading and limited turndown?
Turndown and flexibility are in reality functions of cost. If money is no object, rarely the case, a new treatment plant can be built to handle any and all conditions efficiently. But in most cases, cost-benefit decisions constrain the capacity of a plant to a narrow range of operating conditions, leaving operators to figure out what to do outside the design envelope.
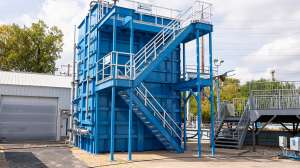
Such was the case with the Nassau (Fla.) Regional Wastewater Treatment Plant, where the staff figured out how to produce effluent with a total nitrogen of less than 3.0 mg/l while treating roughly 33 percent of design load and managing feed from more than 45 independent lift stations.
The plant actually has three effluent permits, one for reuse on site that has a total nitrogen limit of 12 mg/l, and permits for off-site reuse or wetland discharge, both total nitrogen limits of 3.0 mg/l.
The Nassau MBR plant was built for roughly $10.4 million. Based on rated capacity, the normalized cost of the plant is $5.20 per gallon, or about 40 percent less than the national average for similar MBR systems, which is $8.60 per gallon.
The initial decisions that were made to control costs included low blower turndown (1.2:1), reduced freeboard (about 7 inches), elimination of equalization and reduced permeate control. All these factors made operating outside the intended design more challenging, but achievable.
The plant faced extreme diurnal flow variations coupled with lower-than-expected daily loading. Therefore, the effluent nitrogen was such that the water was initially best suited for on-site reuse, rather than off-site reuse or wetland discharge, until some of the strategies presented here were implemented and performance improved.
For some time after commissioning, nitrogen excursions would drive up total nitrogen numbers to as high as 10.4 mg/l. But now, effluent nitrogen is consistently less than 3.0 mg/l, even going as low as 1.6 mg/l. In fact, looking at the year of data in Figure 4, one could say, “It’s not how you start, it’s how you finish.” Operators took a challenging startup and turned the plant into a solid performer.
About the author
Dennis Livingston, P.E., is MBR systems director for Enviroquip, a division of Eimco Water Technologies, based in Austin, Texas. He can be reached at 512/834-6019 or Dennis.Livingston@glv.com.