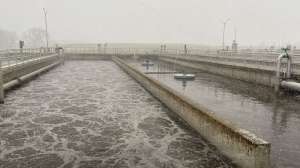
When algae bloom in a reservoir or other surface water source, the result can be taste and odor issues and customer complaints. It then becomes important to identify the exact cause and start treatment. It’s better still to be able to see such a problem coming and take preventive action.
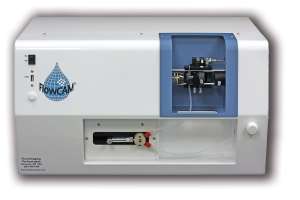
The FlowCAM digital imaging particle analyzer from Fluid Imaging Technologies simplifies and speeds up the process of identifying and quantifying nuisance algae, taste and odor algae, and toxic cyanobacteria. It helps water system personnel reach conclusions much faster and with greater certainty than they could by traditional means.
The system automates the process, freeing personnel for other tasks. It can also interface with laboratory information management systems (LIMS), taking even more staff time out of the equation. Lew Brown, technical director with Fluid Imaging, talked about the technology in an interview with Water System Operator.
WSO: What has been the traditional method for identifying and counting algae?
Brown: The way it’s typically done, if it’s done at all, is with human beings looking through microscopes. You put a drop from a sample on a microscope slide and someone tediously goes through and counts the microorganisms. That is very labor-intensive and is prone to error. More significant is that a technician spends an hour to gather maybe 50 data points of each species, which from a statistical standpoint does not yield very good confidence when you’re talking about a sample from a reservoir that may contain a billion gallons of water.
WSO: In contrast, how does FlowCAM technology do the identification and counting?
Brown: As water passes through a flow cell, the device snaps a picture of it. It then segments out each particle, stores that particle’s image, and performs up to more than 30 measurements on it. When that process is done, you can use mathematical filtering to bin each type of image into a category. So for instance, you can separate Anabaena, which is a blue-green cyanobacteria, from other organisms that have different shapes. The device can do so much so fast without an operator that you can identify thousands of particles in minutes, where manually you could identify tens of particles in hours.
WSO: How are samples fed to this instrument?
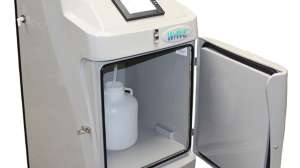
Brown: The typical practice is to take grab samples from different parts of the reservoir. Then you pipette water from a sample into the device. It has a pump that pulls the sample through the flow cell. Depending on what you’re looking for and the magnification you choose, you can process several milliliters per minute, versus the small amount on a microscope slide. Once you set it up, you can just let it run. If you want more data points, you can let it run longer or process more samples.
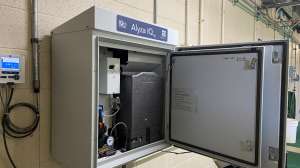
If you want, you can hook the unit up to a pipeline and slipstream off that to do inline analysis. The only issue is that when you’re looking for taste and odor algae, different parts of the reservoir will have different concentrations. There may be a cove that’s especially prone to certain types of algae. So the advantage of processing individual grab samples is in being able to measure those specific areas.
WSO: How can this technology help head off a taste or odor event?
Brown: The way these events happen is that you get an algae bloom — you go from a low to a very high concentration in a short time. If you sample and monitor regularly, you have a chance of looking at the trend. You see an increase in taste and odor algae and you can stop it before the bloom happens and it really becomes a problem. For example, you can take Sunday’s run, Monday’s run, Tuesday’s run, Wednesday’s run, plot them out in Excel, and look at the sample-to-sample trend.
WSO: In simple terms, how does this technology work?
Brown: The object is to restrict the particles to a certain area so the system can focus on them. Think of it as a microscope with a very narrow rectangular flow cell perpendicular to the optical axis. On one side of that flow cell is a flash LED that acts as a strobe light, and on the other side is a camera that looks through the microscope optics.
As the particles flow by, we synchronize the flash and the camera acquisition to freeze a picture of the microscope’s field of view containing liquid and particles. That image is digital. We then do gray-scale thresholding that isolates the particles from the background. So if an image frame has only one particle, we isolate that particle, cut it out like a cookie cutter and save just that part of the image. That greatly reduces the amount of data the system has to store.
WSO: How are the particles identified after they are imaged?
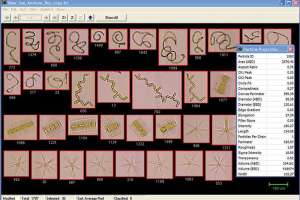
Brown: At the same time we store the image, we run image processing algorithms to do the measurements. We measure spherical diameter, length, width, circularity, color, transparency — there are more than 30 parameters we can measure. Each image is then stored in what we call a collage file, and for each image there is a row in a spreadsheet that contains all those measurements.
In our VisualSpreadsheet software, we present the images so the user can look at them. They can go in and say, “Find me all images between 10 and 20 microns in diameter.” Boom, there they are on the screen. With all those image parameters, users can construct filters that look for specific types of images. Then they can go into one of the collage files of images, click on six or seven and select “Filter Like Selected.” The system then performs statistical pattern recognition and finds all those similar images.
WSO: Does the analysis tell how many of each kind of organism are present?
Brown: Yes. It gives you a concentration in particles per milliliter. And because you get that number based on a much larger statistical sample than you would have by manual methods, you get higher confidence in the results.
WSO: What does the report to users look like?
Brown: A filter tab on the main window lets them view the species present and the concentrations. They can export that data directly into Excel and then into a LIMS.
Typically what they want to know is the concentration of each species. They can graph that over time by taking several samples and putting them on a time clock.
WSO: Is there any kind of check and balance on the system’s accuracy?
Brown: We save every particle image, and users can interact with them on the screen. If someone would ever question the data, they can go back and look. For example, they can click on the filter for Tabellaria, and it will show all the images the system classified as Tabellaria. It’s not a “black box.” You basically have an audit trail.
WSO: What is the value of sending the data to a LIMS?
Brown: By receiving the summary data, the LIMS can watch the trends. If it sees an increase in certain types of particles, that can trigger an alarm, which sends someone to actually look at the data. Then the utility can take action if needed. The whole idea is to reduce the amount of data an actual human has to look at while increasing confidence in the results.
WSO: What other applications does this system have on the drinking water side?
Brown: You can use it to monitor filter performance. If you have a large filter that’s supposed to filter down to a certain particle size, you could take regular samples or have an inline sampler below the filter and just watch the trend. If all of a sudden you start seeing big particles where you shouldn’t see them, maybe you have a filter break. That needs to be detected early, and time is of the essence.