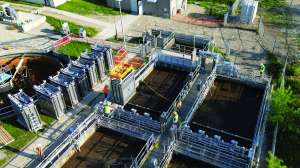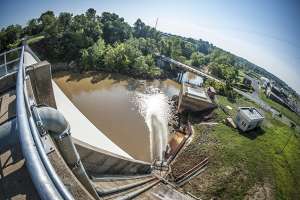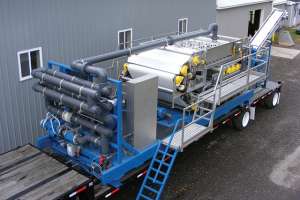


An upgrade converted the 200,000 gpd New Castle (Colo.) activated sludge wastewater treatment plant to a 600,000 gpd Kruger AnoxKaldnes HYBAS system (integrated fixed-film activated sludge or IFAS) serving 1,600 homes and averaging 235,000 gpd.
Operators expected an increase in energy demand when the plant went online in September 2009, but the actual numbers surprised them. "We were primed and ready for some vehicle to help us reduce our energy consumption," says lead operator Eli Jennings.
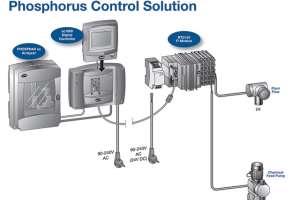
Garfield Clean Energy (GCE)/CLEER, a nonprofit energy consulting firm in Carbondale, provided a solution as part of a U.S. EPA energy management pilot program. The company supplied current transformers to measure three-phase/480-volt incoming current, and an AcquiLite data acquisition server (Obvius) to upload the information to Energy Navigator, its Web-based energy-reporting tool.
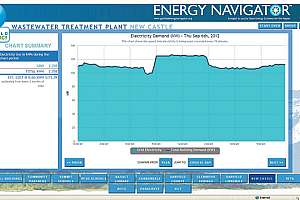
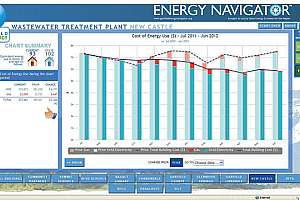
The system, installed in April 2011, takes power usage views every 15 minutes, allowing operators to see spikes the next morning and modify procedures. In 2010, the plant's base year, the energy bill totaled $82,000. By the end of 2012, peak demand dropped from 179 to 149 kW, a 16.8 percent reduction. The facility also saved 90,635 kWh or 7.8 percent. "We lowered our electric bill by $11,294, but the figure includes a utility rate increase," says Jennings.
CLEER (Clean Energy Economy for the Region) developed and manages Energy Navigator. A grant from GCE paid for the $5,000 hardware package. The town's membership in GCE pays the $900 annual data management costs and for the reporting tool. The firm also arranged for operators and town officials to take part in a U.S. EPA pilot training program on energy management.
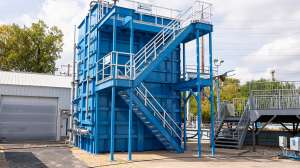
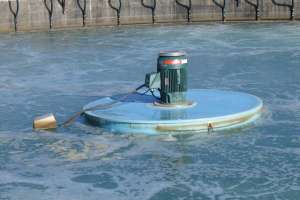
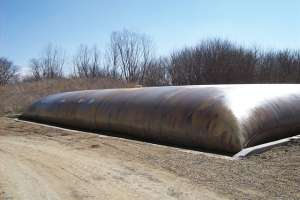
The plant upgrade included adding a pre-anoxic basin with internal recycle as part of the IFAS system, a 320,000-gallon, two-cell aerobic digester with Tideflex coarse-bubble "duckbill" diffused aeration, and a secondary clarifier. UV disinfection replaced chlorine. The original 100,000-gallon aerobic digester was converted to a biological odor control facility, but the two active and one redundant Spencer multistage centrifugal 40 hp blowers were piped to the new digester to save money.
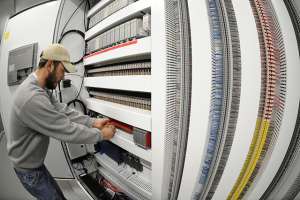
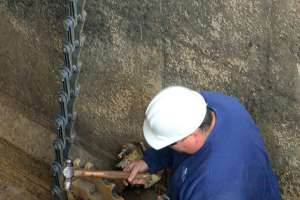
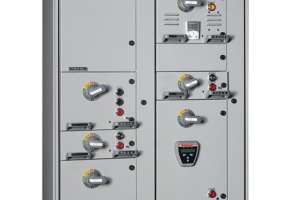
"Xcel Energy bills us 4 cents per kWh and $20 per kW of demand," says Jennings. "We wanted information on where we were spending that money." To install the hardware for transmitting live data, Xcel killed the plant's main power and ran the backup generator for an hour, enabling an electrician to install the current transformer loops. "It was an easy job," says Jennings. "Planning it took more time than doing it." They mounted the data acquisition server in the plant's office.
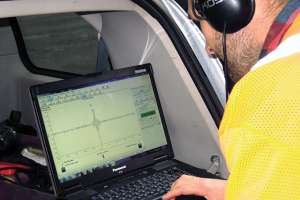
CLEER energy engineer Mike Ogburn monitored the installation, then explained the company's website and Energy Navigator functions. "It's quite simple," says Jennings. "We can track daily, weekly, monthly, annual and multi-year trends in power consumption. Anyone with Internet access can see it. I use my smartphone at home."
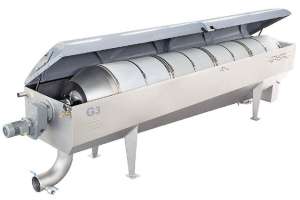
"Aeration is our biggest energy hog," he says. "The first thing we noticed on Energy Navigator was huge spikes of demand when starting the centrifuge while the digester blower system was running." The old system was not tied to the SCADA system, so operators manually throttled back or shut down one or both blowers during centrifuge startup. The drop in the energy demand and usage was immediate.
"We're planning to upgrade the blower control system and add instrumentation in the new digester to improve our efficiency further," says Jennings.
At the same time, operators used the variable-frequency controls to reduce the speed of the active and redundant 100 hp blower in the IFAS system. They reduced dissolved oxygen (DO) in all the basins and digesters, slowing blowers to match demand. Smoothing out flow spikes to the equalization basin also help reduce energy usage.
"Daily views help us see operational patterns," says Jennings. "Knowing what time spikes occur is as important as the amount of the spike. We have so much automated equipment that we have to check the report's time stamp against our SCADA system to find out what was running when the spike happened."
Weekly live views enable operators to see peaks in demand, identify the days when they occurred, relate them to flows, and work to reduce them. Monthly views allow them to see daily energy usage and compare progress with the same month of the previous year. The yearly view, generated from utility bills, serves as the plant's report card.
"Plants with $20,000 or higher annual electric bills should think about live data driving operations," says Ogburn. "It makes sense because the usual savings are in the 10 percent range, but we've seen up to 40 percent."
CLEER's program to improve operations in buildings and even vehicle fleets fit in with the city's active energy management policy. The system also tracks temperature, Btu, solar electric production, and solar thermal data. "We've had Energy Navigator for more than a year now and still use the information daily to fine-tune operations," says Jennings. "The exciting thing is our energy savings are projected to be $10,000 for 2012, and our kilowatts of demand to be down 16 percent from 2010."