Monitoring the treatment of wastewater from influent to effluent was a persistent challenge for the team at the Penn Yan (New York) Wastewater Treatment Plant.
Operators received data on pH, dissolved oxygen, suspended solids, temperature and other parameters from instruments, and also gathered results from samples sent to laboratories. They used paper bench sheets later entered into an Excel spreadsheet for performance tracking.
All the lab results, instrument readings and bench sheets were manually entered into spreadsheets for different purposes. The manual data entry was time-consuming and prone to errors. In addition, having data stored in different spreadsheets wasn’t optimal for understanding the performance of the system as a whole.
“We were chasing data all over the place in multiple spreadsheets, which made it very hard to troubleshoot issues and difficult to see long-term trends,” says Yvonne Tucker, chief operator.
Penn Yan solved those problems in 2022 by moving from paper to a digital solution. The Rio software program from Aquatic Informatics now helps the team manage plant operations by collecting and organizing data into actionable insights.
GUARDING RESOURCES
Penn Yan (population 5,000) lies on the north end of Keuka Lake in the heart of the Finger Lakes region of New York. The Keuka Lake Outlet carries water through the village along with two small creeks to Seneca Lake, the largest lake in the Finger Lakes chain.
These waterways and the power they generated were a principal reason for the establishment of the village in 1799. Today, residents and summer vacationers enjoy many recreational activities along the lakes and the outlet. Protecting those waterways is a top priority for the Penn Yan treatment plant operations team.
The wastewater treatment plant was built in 1983 with a design flow of 1.8 mgd. During heavy rain events, flows can increase from the average 1.2 mgd to as much as 5.6 mgd in less than 30 minutes. The secondary treatment process is comprised of 16 rotating biological contactors. Nitrification takes place on the last 10 RBCs, and polyaluminum chloride is used to reduce total phosphorus to less than 1 mg/L.
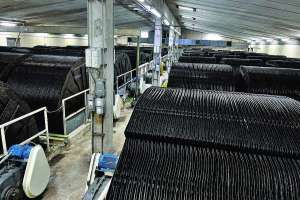
On the solids side, anaerobic digestion is followed by mechanical screw press dewatering and biosolids compost production. While industrial users account for only about 10% of the plant’s flow, periodic spikes can cause overloading that upsets the treatment process.
The new software helps the plant team respond more effectively to such upsets and other conditions. Among its capabilities, it can integrate with electronic lab transfers, pull data from instruments, and allow personnel to capture field data with a connected mobile device. Operators can receive notifications by way of an app or email if a parameter setpoint has been exceeded.
Having all the data securely stored in the cloud improves operational visibility. Before and after weekends and holidays, operators let their co-workers know if something is amiss, but at times circumstances don’t allow those conversations to happen. With information from the previous shift at their fingertips, the new crew can have a quick glance at recent events.
DATA FOR TROUBLESHOOTING
Like most treatment plants, Penn Yan has redundancy at its pump stations. Evening out pump runtimes ensure that maintenance is performed when needed. A deviation in runtimes can indicate a problem.
“We recently installed a new pump station and began to notice that one of the pumps was accumulating more hours than the other,” Tucker reports. “On investigation, our team found that the T-joint on the pipe had come apart, so when that pump was on, water was coming back into the wet well, and it had to pump longer than the other one. By monitoring and trending pump hours in Rio, we were able to identify the problem.
“We can now be more predictive. We can avoid some problems and investigate others quickly and easily, so we can improve our response time to fix them in the future.”
A single data platform gives operators a much better understanding of performance and whether changes need to be made to keep the treatment process working efficiently. For example, if the load cells for the RBCs on only one of the two trains should show a trending increase in weight, that would indicate an uneven flow or loading condition.
That in turn would require an adjustment to the splitter box ahead of the RBC process to balance the distribution between the two trains. Continued uneven distribution could reduce treatment efficiency or increase stress on the mechanical equipment, possibly leading to a catastrophic failure.
For another example, a leading indicator of a healthy anaerobic digester is the ratio of volatile fatty acids to alkalinity. The Penn Yan plant operates at a ratio around 0.12. A change in the pH can cause the bacteria to stop functioning, leading to a sour digester and possibly foaming issues. “Using Rio we can watch this ratio trend closely and adjust how much we are feeding the digester, or add alkalinity to buffer the acid if needed,” Tucker says.
VISUAL ANALYSIS
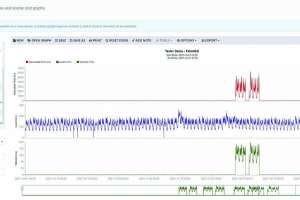
As a relatively small treatment plant, Penn Yan monitors about 75 parameters from regulatory influent/effluent measurements to process control data. The new platform allows Tucker to select and analyze any number of parameters over any period.
Previously, she had to pull data from multiple spreadsheets to compile reports. Now, with a few clicks, she can create graphs and dashboards to visualize trends or identify relationships between any number of parameters: “We can create the graphs we need, on-demand, 10 times faster now. It’s a huge time-saving feature.”
As summer approaches, the village’s population swells, and organic loading to the plant increases, often leading to higher sludge blanket levels. Now, Rio can alert operators with warning level limits set in advance. Historical data can be easily trended and operational strategies to handle the higher sludge blankets can be quickly implemented.
REPORTING AND COMPLIANCE
Tucker uses the software to produce monthly discharge reports and other quarterly reports. Since most data is automatically fed into the system, compliance reporting takes far less time, and without repetitive data entry there is less chance for error. Having all the data in one place adds a layer of defensibility to reporting and is also helpful when a permit exceedance occurs.
In that event, the village needs to follow protocols that start with notifying the Department of Environmental Conservation. “The next step is to understand why we had a violation, so we go through the plant looking for problems,” Tucker says.
“We check the operation of chemical metering pumps and make sure we are adding enough chemicals to help with settling. We compare the industry flow to see if their contribution is causing a negative impact. We look at what is in the influent and check to ensure that the flow did not exceed the design parameters of the tank, and so on.
“We can easily see the whole process. We can overlap data to compare time periods and determine what happened so we can get back into compliance.”
CAPTURING HISTORY
In the days of manual data analysis, a stakeholder who wanted to see the last year of flow data would need to pull data from 12 spreadsheets and copy and paste it into one, a time-consuming job that might or might not yield any valuable insight. Today, Tucker can select and organize the data she needs for almost any request, providing transparency and enabling reports that visually showcase pertinent results.
New hires joining the team need to get up to speed quickly on plant operations; consolidated digital information helps that process significantly. And as things change over time, operators have a reliable historical baseline to help with decision-making.
Small communities with small budgets are held to the same standards and regulations as larger utilities, Tucker observes: “It’s vital for small teams like ours to use every tool we can to streamline operations and work processes as our roles and responsibilities often encompass a more diverse spectrum to those of our colleagues in larger utilities.”
ABOUT THE AUTHOR
Scott Dorner (scott.dorner@aquaticinformatics.com) is data management product manager for Aquatic Informatics.