Think of the last time you ran a settleability test at an activated sludge wastewater treatment plant. It was probably nothing to write home about.
Sometimes you might wonder why you run the test so much. It never really changes, so why not just run it once a month instead of once a week? It seems every plant has its own standard operating procedure (SOP) for running the settleability test.
As ordinary as this test may seem, it’s important to understand how it should be performed and the valuable data it provides. A case study will show how the test can prevent poor treatment plant performance — if we pay attention to trends in settling characteristics.
The settleability test is an analysis of the settling characteristics of the activated sludge mixed liquor suspended solids (MLSS). It is often referred to as “running a settleometer.” The test is normally done at the treatment plant rather than a certified laboratory. It includes five basic items:
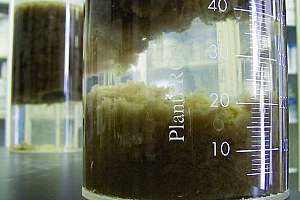
The idea of the test is to provide a place where the MLSS can quietly separate from the liquid water. The MLSS solids consist mostly of bacteria with some organic and inorganic debris mixed in. The debris can be finely shredded toilet paper, paper towel fibers, vegetable fibers, plastic material, seeds, insect parts — you name it.
During the first five minutes of the settleability test, the bacteria clump together, forming large clumps (floc). These floc particles are slightly denser than water — this helps with settling and compaction. After initially clumping together, the floc begins to settle toward the bottom of the container, squeezing the clear liquid out and up toward the surface.
Compare the perfect settling sludge with the Goldilocks analogy: A large, open and irregularly shaped floc particle that has little density will settle slowly, perhaps compacting poorly by the end of the test. This biomass settles too slowly. Conversely, you may see an MLSS that has small, round-edged floc particles that are dense and settle rapidly. This type of MLSS may leave much turbidity (cloudiness) in the liquid water above the settled sludge. The biomass appears granular and settles too fast.
What most operators hope to see is the perfect settling: not too fast, not too slow. First, it should form a large floc particle that settles well and also traps fine particles that make up the turbidity around the floc. Second, the biomass should produce a clear liquid above the settling solids — the liquid that will become the plant effluent. This biomass settles just right!
While today’s operators have access to a great deal of monitoring and process control technology, the settleability test is still one of those old-fashioned tests that relies on operator awareness and skill. The results can be entered into computer spreadsheets and used to perform calculations like sludge volume index, but the settleability analysis is still operator based. Here is a summary of how to run a settleability test:
Once the test is complete, use graph paper or a computer program to enter the data into a trend chart. This is one of the most crucial steps in the test: analyzing the settleability test results.
Many operators go through the motions of the settleability test without really paying attention to the valuable information it provides. We collect the sample, pour it into the settleometer, set the timer for 30 minutes and walk away. When the 30-minute alarm sounds, we get the reading, write it down or log it in somewhere, and pour out the container.
When we collect the readings every five minutes, we stay close to the test while it’s running. We pay closer attention to what’s happening during the settling, watch the flocculation during the first five minutes, see the compaction occur as the flocculated sludge gains weight, and notice the little canals or channels of water rising above the sludge as it settles toward the bottom.
At the 30-minute mark, the biomass has settled and compacted, hopefully leaving clear supernatant above the blanket of solids. Additional settling time (the next half-hour) might show some additional compaction of the biomass or clarification of the supernatant. This is also important to note.
I learned a tip from a trainer during an activated sludge troubleshooting class many years ago that I found very useful and true: You will notice that when the biomass is settling well, the 30-minute reading will be half of the five-minute reading. For example, if the five-minute reading is 900, the 30-minute reading will be about 450. Compare that to when settling is too rapid and is leaving much turbidity in the supernatant: The five-minute reading might be 350, and the 30-minute reading 300. If we plot these results on a graph, the line looks like an L.
What do we not want to see during the settling test?
A good friend who is a consultant and trainer shared a story of a plant upset that occurred mostly because the plant operators were not really paying attention to the settleability test, among other things. The SOP was to collect the MLSS sample, run a settleability test, record the five-minute and 30-minute readings and also run an MLSS test on the sample using the gravimetric method (filter paper, drying oven, analytical balance, desiccator). The results were recorded on a lab bench sheet and filed away. Constant MLSS was the facility process control strategy, with a target MLSS of 3,200 mg/L.
The plant upset happened slowly, and the final effluent turbidity and effluent total suspended solids became too great for public access reuse. Therefore the effluent had to go to reject percolation ponds. The golf courses that relied on the plant’s reclaimed water for irrigation had to resort to alternate sources. How did this happen?
The evidence indicated that while the MLSS quantity increased very little, staying close to 3,200 mg/L, the MLSS characteristics changed quite a bit. Over time the MLSS became a rapid-settling biomass that left behind much turbidity. While the 30-minute reading stayed close to normal (about 300), the five-minute reading changed greatly.
When the plant was running well, the five-minute reading was about 650 to 700. This reading gradually decreased, until eventually all settling took place in the first five minutes (a reading of 300). If these results are plotted on a graph, one can see the difference in the path the biomass took to get to the 300 mark (see graph).
The MLSS remained close to the target, but the SVI and settleability test results did not. The five-minute results were recorded, but no attention was paid to them. In the final analysis, seasonal flows had changed, causing less food as BOD available for the biomass. This reduction in the food-to-microorganism (F/M) ratio, and the increase in sludge age, could have been avoided by maintaining a lower MLSS during the low-flow season.
A pioneer in our field, Alfred West taught and practiced activated sludge process control using total sludge quality principles including the settleability test, SVI and F/M ratio. He also championed the use of a laboratory centrifuge as a quick process control tool for sludge age calculations and process adjustments. If we go back to these basic principles of sludge quality, paying attention to what the settleability test tells us, we can prevent poor operating conditions, just as he described in the 1970s.
My friend in the case study worked with the operators to improve sludge quality by increasing the waste rate to remove some of the old, dense solids. They also added a supplemental source of organic material (manure) to the MLSS to increase the F/M ratio. This jump-start caused a shift in activity and population among the groups of bacteria working together in the biomass.
It took about two weeks to achieve the quality of biomass they were looking for — one that produces high-quality reclaimed water. In the meantime, they made sure the dissolved oxygen was in the range of about 2.0 mg/L in the aeration basins and kept the effluent filters backwashed properly. Closer monitoring of the settleability test results along with regular microscopic examination of the MLSS and tracking of the F/M ratio has also helped.
By now presumably you can see that the settleability test is a simple yet valuable tool for operators of any activated sludge treatment plant. Remember that each plant runs differently and will exhibit its own biomass settling characteristics. By running and observing the settleability test often, and taking time to analyze the data it provides, operators can gain a window into the world of biomass.
Ron Trygar is a process control specialist with the Hillsborough County
(Florida) Public Utilities Department. He can be reached at TrygarR@hillsborough county.org.